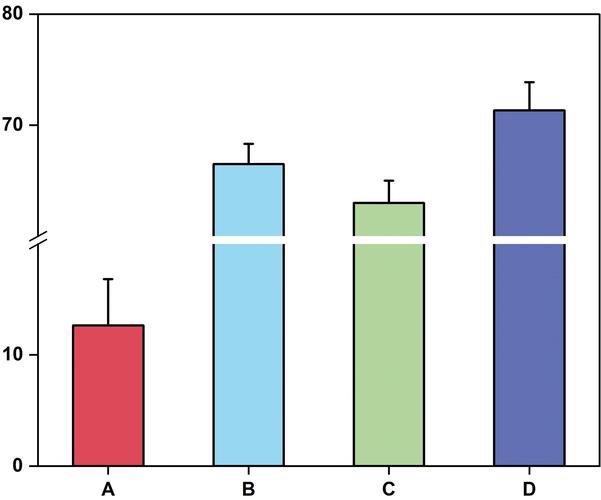
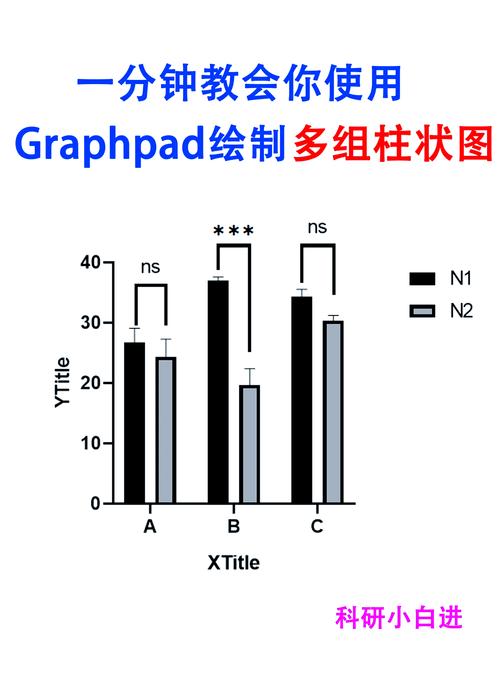
是使用HTML5 Canvas绘制柱形图的详细指南,涵盖从基础到进阶的功能实现:

核心原理与准备工作
- HTML结构搭建:在页面中添加
<canvas>元素并设置其宽度和高度属性。<canvas id="chartContainer" width="800" height="600"></canvas>,该元素作为绘图载体,所有操作均基于此区域进行; - 获取绘图上下文:通过JavaScript获取Canvas的2D渲染接口:
const canvas = document.getElementById('chartContainer'); const ctx = canvas.getContext('2d');,此对象提供如填充、描边等核心绘图方法; - 数据组织方式:建议采用数组存储数据集,每个元素对应一根柱子的高度值。
const dataValues = [45, 78, 32, 61, 93];可扩展为包含标签的对象数组以增强可读性。
关键实现步骤详解
坐标系统建立
需手动计算布局参数以确保图表适配容器,典型计算公式如下表所示: | 参数 | 说明 | 示例取值 | |--------------|----------------------------------------------------------------------|------------------------| | marginLeft | 左侧边距用于显示刻度文字 | 60px | | barWidth | 单根柱子的固定宽度 | 40px | | gap | 柱子之间的间隔空间 | 20px | | maxValue | 根据数据集最大值确定的纵轴上限 | Math.max(...dataValues)| | scaleFactor | 像素/单位值的比例系数(=可用高度/maxValue) | (chartHeight)/maxValue |
主体绘制流程
- 循环渲染柱子:遍历数据数组,依次执行以下操作:
- 计算横坐标:
x = marginLeft + index(barWidth+gap); - 转换数值为像素高度:
barHeight = value scaleFactor; - 设置填充样式:支持渐变色或动态配色方案,如
ctx.fillStyle =hsl(${i60}, 70%, 50%)``; - 绘制矩形:使用
fillRect(x, yBaseLine barHeight, barWidth, barHeight)实现自底向上的生长效果;
- 计算横坐标:
- 辅助元素添加:包括坐标轴绘制(
beginPath(),moveTo(),lineTo())、网格线铺设、刻度标记及文本标注等,特别注意Y轴需反转方向才能符合数学坐标系直觉。
交互功能增强
通过事件监听实现动态反馈:
- 鼠标悬停检测:绑定
mousemove事件,利用isPointInPath()判断当前坐标是否落在某根柱子内; - 高亮效果实现:当检测到悬停时,先保存原始状态,再重新绘制目标柱子为高对比度颜色,并在顶部显示工具提示框;
- 点击交互扩展:可结合数据集索引实现详情弹窗或联动其他组件更新。
高级优化技巧
- 性能提升策略:对于频繁更新的场景(如实时监控面板),采用双缓冲技术——预先在离屏Canvas完成绘制后一次性渲染到主画布,避免闪烁问题;
- 响应式适配方案:监听窗口大小变化事件,动态调整Canvas尺寸的同时按比例缩放所有元素坐标;
- 动画过渡效果:运用
requestAnimationFrame实现柱子高度从零开始平滑增长的入场动画,配合缓动函数使运动更自然; - 视觉分层处理:通过阴影偏移(
shadowBlur,shadowColor)、内嵌描边等技术增加立体感,重要数据项可采用爆炸式突出显示。
完整代码示例
<!DOCTYPE html>
<html>
<head>Canvas Bar Chart</title>
    <style>canvas { background: #f5f5f5; }</style>
</head>
<body>
    <canvas id="salesReport" width="900" height="500"></canvas>
    <script>
        // 初始化配置
        const config = {
            data: [120, 200, 150, 180, 90],
            labels: ['Q1', 'Q2', 'Q3', 'Q4', '年度总计'],
            colors: ['#FF6B6B', '#4ECDC4', '#45B7D1', '#FFA07A', '#98D8C8']
        };
        // 主绘制函数
        function renderChart() {
            const canvas = document.getElementById('salesReport');
            const ctx = canvas.getContext('2d');
            const { width, height } = canvas;
            // 清空画布
            ctx.clearRect(0, 0, width, height);
            // 计算布局参数
            const margin = { top: 30, right: 30, bottom: 50, left: 60 };
            const chartAreaWidth = width margin.left margin.right;
            const chartAreaHeight = height margin.top margin.bottom;
            const barSpacing = 15;
            const maxValue = Math.max(...config.data);
            const xScale = chartAreaWidth / config.data.length;
            const yScale = chartAreaHeight / maxValue;
            // 绘制坐标轴
            ctx.strokeStyle = '#333';
            ctx.lineWidth = 2;
            // X轴基线
            ctx.beginPath();
            ctx.moveTo(margin.left, height margin.bottom);
            ctx.lineTo(width margin.right, height margin.bottom);
            ctx.stroke();
            // Y轴主线
            ctx.beginPath();
            ctx.moveTo(margin.left, margin.top);
            ctx.lineTo(margin.left, height margin.bottom);
            ctx.stroke();
            // 创建柱子并添加标签
            config.data.forEach((value, index) => {
                const barHeight = value  yScale;
                const xPos = margin.left + index  xScale + barSpacing/2;
                const yPos = height margin.bottom barHeight;
                // 绘制柱体
                ctx.fillStyle = config.colors[index % config.colors.length];
                ctx.fillRect(xPos, yPos, xScale barSpacing, barHeight);
                // 显示数值标签
                ctx.fillStyle = '#000';
                ctx.font = 'bold 14px Arial';
                ctx.textAlign = 'center';
                ctx.fillText(value, xPos + (xScale barSpacing)/2, yPos 10);
                // 添加分类名称
                ctx.fillText(config.labels[index], xPos + (xScale barSpacing)/2, height margin.bottom + 25);
            });
        }
        // 页面加载完成后执行绘制
        window.onload = renderChart;
    </script>
</body>
</html>
相关问答FAQs
Q1:如何解决Canvas绘制的柱形图在不同设备上模糊的问题?
A1:可通过两个途径解决:①根据设备像素比缩放Canvas尺寸(例:canvas.width = window.devicePixelRatio desiredSize);②使用CSS设置transform: scale()替代直接修改宽高属性,保持矢量清晰度,高清屏适配还需注意字体渲染质量设置。
Q2:怎样实现多组数据的分组柱形图?
A2:核心在于调整柱子的定位算法,例如将并排显示的两组数据视为一个整体单元,每个单元内包含两个狭窄的柱子,具体实现时需要:①缩小单柱宽度;②精确计算相邻组间的偏移量;③交错设置不同系列的配色方案,推荐先绘制完第一组所有柱子后再处理第二组,便于


